Find out more about the latest developments in credit risk management for your industry.

Logo Created with Sketch. SCHUMANN - EN

Key figures in credit and receivables management: This is what matters

Credit and receivables management provide important key figures for the evaluation of your own performance capability. Read here which ones you should know.
Blog Post
, Dr. Stefan Gröger

Which key figures should be evaluated regularly in receivables and credit management? And how can regular analysis be performed using as few resources as possible? We have put together the most important information for you.

Credit and receivables management as parts of debtor management provide important key figures for the evaluation of your own performance capability.

The information gained can be used to derive starting points for the optimization of internal processes. In addition, the key figures serve as early warning indicators and allow conclusions to be drawn about possible risks. The company can then take appropriate measures to avoid or reduce these risks before it is too late.

After all, the insights gained are also relevant for sales and should be made available to them: They help in the decision to process the right customers.

Choosing the right Key Performance Indicators (KPIs)

When selecting KPIs it is important to consider their strategic relevance. In the first instance, they should be oriented to the goals that the company or a department has set for itself. This is the only way to ensure that the insights gained are used in line with the corporate strategy and serve as a basis for further corporate management.

The question credit managers should ask themselves when selecting metrics is, "What do I do with the insight?" If an answer to this question cannot be found, the ratio – at least at this point in time – obviously does not have much relevance.

KPIs should therefore

  • measure the achievement of objectives
  • KPIs should therefore form the basis for deriving concrete measures in the event of non-achievement of targets

In this context, less is often more. It makes more sense to analyse few key figures, but the right ones and at regular intervals, than to blindly examine as many unspecific key figures as possible, which are not followed by any measures. As mentioned at the beginning, it is a matter of drawing the right conclusions from the key figures in order to achieve the company's goals.

In addition, the analysis of data and its interpretation can take immense amounts of time if it is not done in a targeted manner and without technical support. A prerequisite for efficient and simple data analysis is that the data is available digitally and can be prepared automatically – including visually. Good credit management systems that output relevant key figures at the push of a button provide support here.
Relevant key figures in credit management

Receivables turnover

How often is the average debtor base included in the sales revenue? This key figure should be as high as possible.
If it is falling over time, this means that the duration of accounts receivable (days sales outstanding or DSO, see next point) is rising. This increases the amount of capital that is tied up, which in turn affects your liquidity. A reduction in this key figure should be understood as a warning: measures should be taken in credit management, for example to reduce the duration of receivables.

DSO (days sales outstanding)

The days sales outstanding, the duration of accounts receivable, can be used as an alternative to receivables turnover. It is one of the most common key figures in credit management and describes the average number of days between invoicing and payment. It should be as low as possible. A short duration of receivables is promoted by

  • a good customer structure (i.e. a high percentage of customers with good creditworthiness)
  • suitable payment conditions
  • stringent receivables management: immediate invoicing, professional dunning procedures

Default ratio

How high is the ratio of defaults on receivables to sales revenue? Logically, this ratio should be as low as possible. This key figure reflects the quality of the measures performed in credit management: are the results of creditworthiness checks accurate and are ratings being calculated correctly using a method which makes sense? Are risks being evaluated realistically or are some risk-relevant aspects being ignored?

Defaults on receivables

How many defaults on receivables are there within a particular time period? Defaults have a 1:1 effect on your liquidity and reduce your profit. And not only that: in general they actually produce costs for dunning procedures.

Success ratio of collection measures

How successful are the measures used in your receivables management? Are there any indications of potential for improvements?

Payment behaviour of existing customers

How has the payment behaviour of your customers developed over time? How high is the percentage of open positions in comparison with current orders?

Cost structure

  • Costs for risk reduction measures
    You should have an overview of which costs occur, for example for trade credit insurance (TCI) – in total and at customer level.
  • Costs for checks
    The expenditure for creditworthiness reports or TCI checking fees have a direct effect on your liquidity.

Value at risk

This ratio is used to measure and monitor market and interest rate risks. Originally a key figure from the banking and insurance sector, it has recently been increasingly used in companies as well. It indicates the risk to which an asset is exposed – considering probabilities and within a certain time horizon. It is helpful in managing the portfolio.

Key figures in receivables management: Automation makes life easier

Thanks to the digitalization of credit management through suitable software, these days it is easy to calculate key figures regularly and at the press of a button. It is important that the necessary data is available in the system. If this is the case, almost any question can be answered easily:

  • How are your customers distributed between the rating classes?
  • What is your current DSO and how has it developed over time?
  • Which are the customers with the highest limits, exposures, open positions and/or outstanding orders?
  • Which of your customers have exceeded their limits by the most?
  • How are open positions/defaults distributed between your branches?
  • For which and how many customers are credit insurance lines available and for what amount?
  • Which totals need to be reported to the credit insurance company?

The visualization of analysis results provides further relief: a large volume of information can be reviewed much quicker if it is presented graphically. The visuals enable an understandable presentation and are a useful supplement for discussions – with, among other, the sales department – and for making decisions on strategic measures.

Product Information

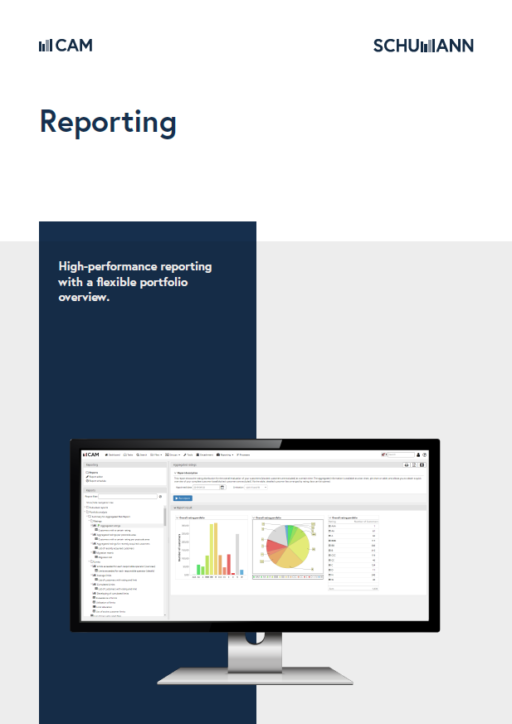
Powerful reporting through IT support

We appreciate your interest. To download the desired file, please fill out the following form.

* required

About the Author
Dr. Stefan Gröger

With a doctorate in business informatics, he managed the development of business areas as well as marketing and sales for the business unit Industry & Trade.

Since January 2023, Dr. Stefan Gröger has been responsible for the sales management of the business units Industry & Trade, Financial Services and Credit & Surety in his role as Commercial Director and member of the Executive Board at SCHUMANN.

Commercial Director, SCHUMANN

Dr Stefan Groeger 500x500